1. What is Frontend Monitoring?
When designing applications, engineers need to understand how users will experience the application across a wide variety of scenarios. For example, a website built as a single-page application may react differently on certain browsers or devices, and teams may need to walk through all of these scenarios. At the same time, teams also need to monitor their applications to ensure each part is behaving as expected. Once an application is in production, errors and performance issues may occur and teams need to quickly troubleshoot to prevent a broken digital experience. The process of proactively testing an application and monitoring user experiences in real time is called frontend monitoring.
Unlike backend monitoring, which focuses on server health, frontend monitoring centers on what users actually see and interact with in their browsers.
Types of Frontend Monitoring
- Proactive Monitoring: Synthetic tests and simulations to catch issues before users experience them, such as simulating slow network conditions or browser interactions.
- Reactive Monitoring: Real User Monitoring (RUM) and session replay that capture real user interactions and errors in production environments.
- Hybrid Approach: Combining both proactive and reactive monitoring for comprehensive coverage.
Key Metrics to Monitor
| Category | Specific Metrics | Description |
|---|---|---|
| Error Monitoring | JS Errors, Promise Errors, Resource Loading Errors, Custom Errors | Detect and diagnose frontend errors that impact functionality and user experience. |
| Performance Monitoring | Core Web Vitals (Largest Contentful Paint, Interaction to Next Paint, Cumulative Layout Shift), Resource Loading Time, API Request Time, Device Compatibility, Third-Party Integrations, DNS/TCP/First-Byte Time, FPS Rate, Cache Hit Rate, First Screen Render Time, FP, FCP, FID, DOMContentLoaded, onload | Measure page responsiveness, loading speed, rendering quality, and API/backend responsiveness. |
| Behavior Monitoring | Unique Visitors, Page Views, Page Access Depth, Page Stay Duration, Custom Event Tracking, User Clicks, Page Navigation, Conversion Funnel | Understand user engagement, navigation patterns, and interaction with features to optimize UX and business goals. |
Benefits of Frontend Monitoring
- Improved User Experience: Identify and fix issues that affect usability and satisfaction.
- Faster Issue Resolution: Quickly pinpoint and address bugs or performance bottlenecks.
- Reduced Downtime: Minimize business impact by catching errors before they escalate.
- Data-Driven Decisions: Use real metrics to prioritize improvements and new features.
2. How Frontend Error Collection Works
1️⃣ Global Error Handlers
// JS Error
// Captures uncaught JavaScript errors globally,
// including error message, source file, line and column number.
window.addEventListener("error", (e) => {
  console.log("error", e);
});
// Promise Error
// Specifically listens for unhandled Promise rejections,
// which are common in modern asynchronous code.
window.addEventListener("unhandledrejection", (e) => {
  console.log("unhandledrejection", e);
});

// Destroy the error handler when the component unmounts
return () => {
  window.removeEventListener("error", handleError);
  window.removeEventListener("unhandledrejection", handleError);
}
2️⃣ Resource Loading Errors
Monitors failures of resources such as images, scripts, and stylesheets by listening to the error event on those elements.
// Resource Loading Error
// Static resouce loading errors don't bubble up to the window object,
// They must be handled during the capture phase.
window.addEventListener("error", (e) => {
    console.log(getErrorInfoFromErrorEvent(e))
}, true)

function getErrorInfoFromErrorEvent(e: ErrorEvent) {
    const target = e.target as HTMLElement;

    const tagName = target.tagName;

    const isSourceErrorEvent = target && tagName;

    if (!isSourceErrorEvent) {
      // Make sure it's the resource loading error
      return;
    }

    const srcAttr = target?.getAttribute('src');
    // link
    const hrefAttr = target?.getAttribute('href');

    return {
      tagName: tagName,
      url: srcAttr || hrefAttr,
    };
};

// Destroy the error handler when the component unmounts
return () => {
  window.removeEventListener("error", getErrorInfoFromErrorEvent);
}
Script Error 0 Explained:
When monitoring frontend errors, you might encounter a generic error message called “Script error”. This often appears as "Script error." with no additional information such as file name, line number, or stack trace. This is commonly referred to as Script Error 0.
This occurs due to the Same-Origin Policy enforced by browsers for security reasons. When a script is loaded from a different origin (domain, protocol, or port) than the hosting page, and an error occurs inside that script, the browser intentionally hides detailed error information to prevent leaking sensitive data across origins.
Add crossorigin="anonymous" to the script tag to allow cross-origin requests.
<script src="https://example.com/script.js" crossorigin="anonymous"></script>
3️⃣ Manual Error Reporting
Developers can use try-catch blocks and explicitly send errors or custom messages to the monitoring service for better context.
4️⃣ SDK Instrumentation
- Monitoring tools inject SDKs that hook into these handlers, enrich error data with breadcrumbs (user actions before error), device info, and stack traces.
- Source maps are uploaded to translate minified code stack traces back to original source code, making debugging easier.
5️⃣ Source Map Upload
When collecting and reporting frontend errors, uploading sourcemaps is essential for accurate stack trace de-obfuscation.
Sourcemaps map minified/obfuscated JavaScript code back to the original source, making error stack traces readable and debugging efficient. However, improper handling of sourcemaps can introduce security risks. Here are key points to address in your documentation:
-
Do Not Expose Publicly: Never deploy sourcemap files (.map) to your production CDN or make them publicly accessible. Sourcemaps can reveal your original source code, including proprietary logic and comments.
-
Upload to Monitoring Service Only: Always upload sourcemaps directly to your error monitoring service via secure channels, not to public web servers.
-
Version Matching: Ensure the sourcemap version matches the deployed JavaScript bundle version. Mismatched versions will lead to incorrect stack trace mapping.
-
Automate in CI/CD: Integrate sourcemap upload as a step in your CI/CD pipeline to avoid manual errors and ensure consistency.
6️⃣ Error Aggregation
Errors are grouped by similarity on the backend to reduce noise and help prioritize fixes based on frequency and impact.
3. How Frontend Performance Collection Works
1️⃣ Core Web Vitals
Modern browsers provide the PerformanceObserver API, which allows you to monitor key user experience metrics in real time. The three most important Core Web Vitals are:
-
Largest Contentful Paint (LCP): Measures loading performance by tracking when the largest content element is rendered.
-
Interaction to Next Paint (INP): Measures responsiveness by tracking the latency between user interaction and the next paint.
-
Cumulative Layout Shift (CLS): Measures visual stability by tracking unexpected layout shifts.
// LCP
const lcpObserver = new PerformanceObserver((list) => {
  for (const entry of list.getEntries()) {
    // entry.renderTime is the LCP time
    console.log('LCP entry:', entry);
  }
});
lcpObserver.observe({ entryTypes: ['largest-contentful-paint'] });

// INP
const inpObserver = new PerformanceObserver((list) => {
  for (const entry of list.getEntries()) {
    // entry.duration is the interaction delay
    console.log('INP entry:', entry);
  }
});
inpObserver.observe({ type: 'event', buffered: true });

// CLS
let clsValue = 0;
const clsObserver = new PerformanceObserver((list) => {
  for (const entry of list.getEntries()) {
    if (!entry.hadRecentInput) {
      clsValue += entry.value;
    }
  }
  console.log('Current CLS:', clsValue);
});
clsObserver.observe({ type: 'layout-shift', buffered: true });
The above is just a basic principle, we can use the web-vitals library to implement monitoring.
2️⃣ Resource Loading Time
const observer = new PerformanceObserver((list) => {
  list.getEntries().forEach((entry) => {
    console.log(entry);
  });
});

observer.observe({ entryTypes: ['resource'] });

// Destroy the observer when the component unmounts
return () => {
  observer.disconnect();
}
But there are some problems:
- In actual scenarios, a large number of resources are loaded on the first screen, and the loading times are relatively dense. On the contrary, the loading times of resources after the load event are not particularly dense.
- If we monitor directly as in the code above, every time a resource is loaded successfully, the callback will be called, and the execution time of JavaScript can be too long, which will block the normal rendering of the page, causing performance issues.
The solution is to combine active acquisition and passive monitoring, that is:
- Use the
loadevent as the boundary of the first screen resource loading. - Do not monitor before the load event.
- Once the load event is triggered, actively acquire all resource information by the
performance.getEntriesByType(type)API. - After that, use
PerformanceObserverto passively monitor the resources.
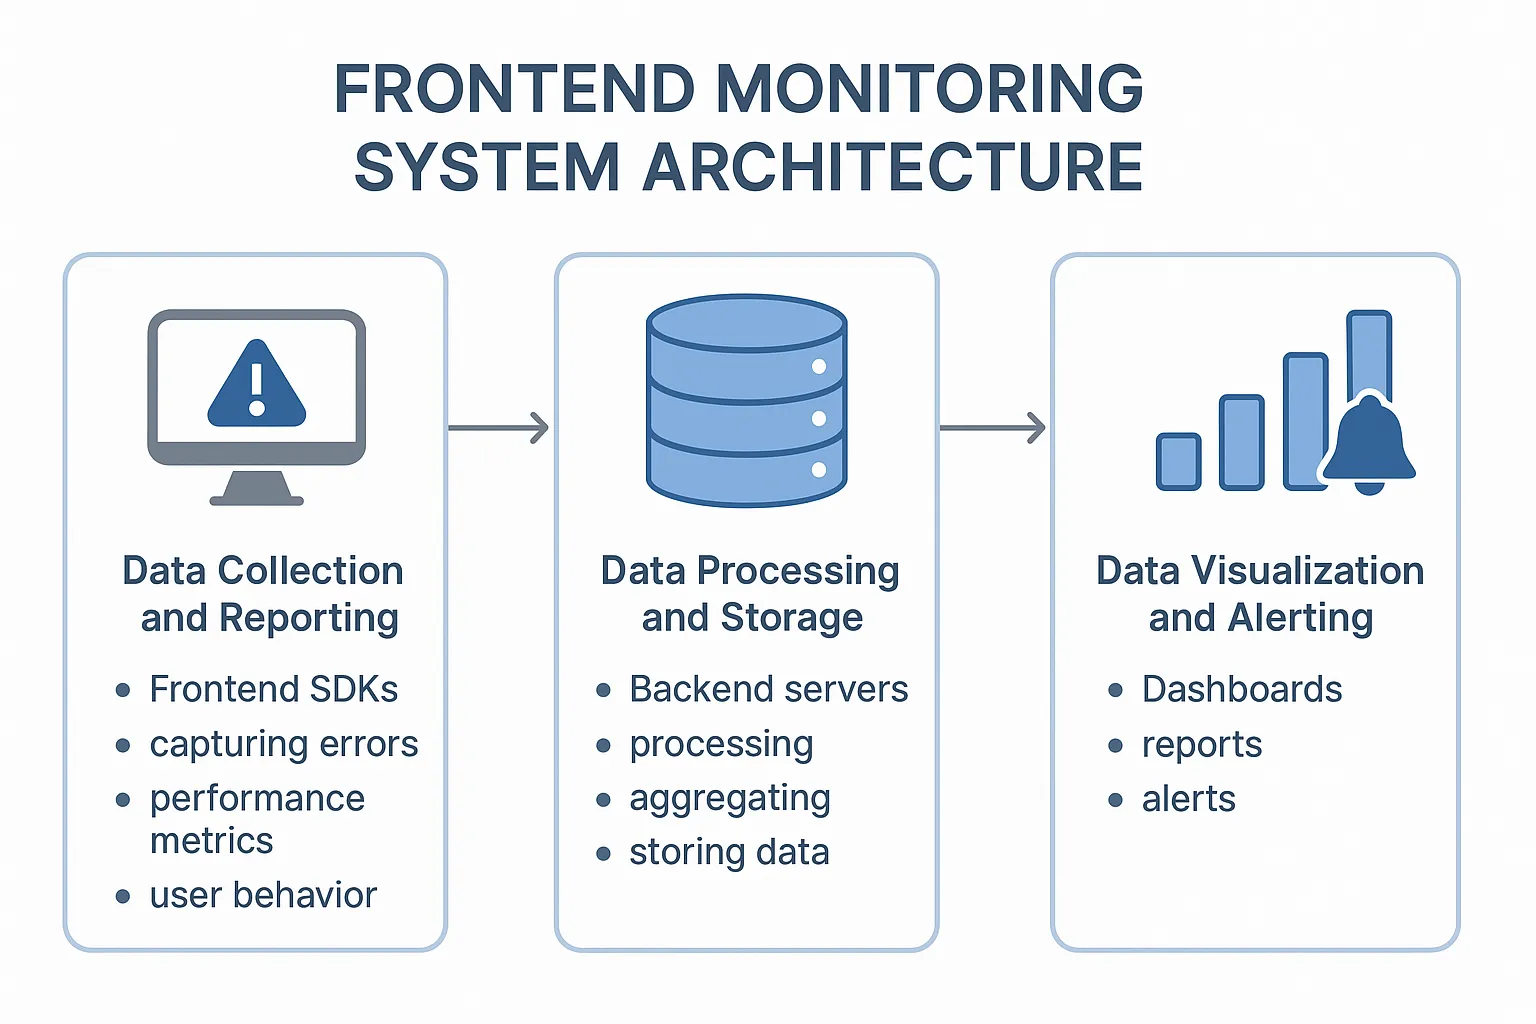
4. Frontend Monitoring System Architecture
A complete frontend monitoring system consists of three main components:
-
Data Collection and Reporting
Instruments the frontend code to capture errors, performance metrics, and user behavior data in real time. This often involves embedding monitoring SDKs (e.g., Sentry, Datadog) that hook into browser APIs and event listeners. -
Data Processing and Storage
Collected data is sent to backend servers where it is processed, aggregated, and stored. This includes error grouping, deduplication, performance trend analysis, and enrichment with metadata like user context and device info. -
Data Visualization and Alerting
Dashboards and reports provide insights into frontend health, user experience, and business KPIs. Alerts notify teams of critical issues, enabling fast response.
5. Best Practices for Effective Frontend Monitoring
- Instrument Early: Integrate monitoring from the start of development to catch issues early.
- Combine Proactive and Reactive Approaches: Use synthetic tests along with real user monitoring.
- Monitor Core Web Vitals: These are critical for user experience and SEO.
- Customize Error Reporting: Add contextual data like user actions, device info, and environment variables.
- Regularly Review and Act: Make monitoring a part of your development and incident response workflows.